


BEIJING and TEL AVIV, Israel, March 20, 2019 /PRNewswire/ --


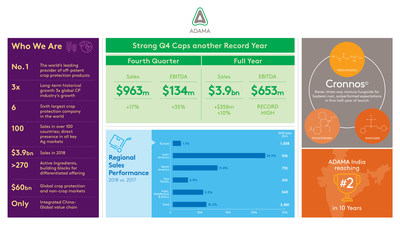
- Q4 Sales increased 17.3% to a record high $963 million, up 22.8% in constant currency terms
- Record Q4 sales driven by robust business growth, led by significant outperformance in Brazil, as well as increased prices, somewhat offset by softer currencies
- Full year sales grew by $358 million, or 10.2%, to a record high $3,881 million (up 12.4% in constant currency terms), driven by 8.1% growth in sales of an increasingly differentiated portfolio, as well as increased prices
- Best-ever performance in most territories, with significant market share gains
- 40% increase in sales of formulated, branded products in China
- Q4 Gross Profit increased 17.6% to a record high $312 million
- Gross margin of 32.4%, in line with last year
- Continued differentiated portfolio growth and price increases partially offset by higher procurement costs and softer currencies
- Full year Gross Profit up 4.4% to a record high $1,291 million; gross margin of 33.3%
- Strong business growth and increased prices more than offset increases in procurement costs and adverse currencies impact; capitalizing on increased backward integration in key products
- Operating cost discipline yields improved cost/sales ratio, driving higher operating profit
- Q4 EBITDA increased 34.5% to a record high $134 million vs. $100 million in Q4 last year
- EBITDA margin of 13.9%, up 1.7 percentage points over last year
- Full year EBITDA reaches all-time record high of $653 million (margin of 16.8%), beating last year's record
- Q4 Income before Tax up 279.4% to $47 million
- Full year Income before Tax above last year's
- Q4 Net Income increased 79% to a record high $46 million
- Full year Net Income of $249 million (margin of 6.4%) vs. $280 million last year (margin of 8.0%)
- 2017 saw relatively low tax expenses, benefiting from tax income from expected utilization of tax loss carry forwards; normalized taxes would have put FY Net Income above 2017 record
- Continued meaningful cash flow generation, while supporting strong growth and absorbing higher procurement costs
- Operating Cash Flow of $305 million in the full year
- Free Cash Flow of $79 million
- Balance sheet net debt of $457 million
- Net debt / EBITDA ratio of 0.7x, in line with the lowest ever same point last year
Leading global crop protection company ADAMA Ltd. (the "Company") (SZSE: 00553), today reported fourth quarter and full year 2018 financial results.
Adjusted, US$m | Q4 2018 | Q4 2017 | % Change | FY 2018 | FY 2017 | % Change | FY 2018 (ex. '17 EU hedge) | ||
Revenues | 963 | 821 | 17.3% | 3,881 | 3,523 | 10.2% | 3,920 | ||
Gross profit | 312 | 265 | 17.6% | 1,291 | 1,237 | 4.4% | 1,331 | ||
Gross margin | 32.4% | 32.3% | 33.3% | 35.1% | 33.9% | ||||
Operating income (EBIT) | 81 | 45 | 79.6% | 441 | 436 | 1.1% | 481 | ||
EBIT margin | 8.4% | 5.5% | 11.4% | 12.4% | 12.3% | ||||
Income before Tax | 47 | 12 | 279.4% | 310 | 308 | 0.6% | 350 | ||
Pre-tax margin | 4.9% | 1.5% | 8.0% | 8.7% | 8.9% | ||||
Net income | 46 | 26 | 78.6% | 249 | 280 | -11.2% | 289 | ||
Net income margin | 4.7% | 3.1% | 6.4% | 8.0% | 7.4% | ||||
EBITDA | 134 | 100 | 34.5% | 653 | 646 | 1.1% | 693 | ||
EBITDA margin | 13.9% | 12.2% | 16.8% | 18.3% | 17.7% | ||||
Earnings per share – USD | 0.0186 | 0.0109 | 0.1017 | 0.1196 | |||||
– RMB | 0.1290 | 0.0720 | 0.6657 | 0.8153 |
All income statement items contained in this release are presented on an adjusted basis. For a detailed description and analysis of the differences between the adjusted income statement items and the items as reported in the financial statements, see "Analysis of Gaps between Adjusted Income Statement and Income Statement in Financial Statements" in the appendix to this release.
Revenue growth in constant currencies in the fourth quarter was 22.8%, and 12.4% in the full year.
Earnings per share are the same for basic and diluted. The number of shares used to calculate earnings per share in Q4 2017 is 2,341.9 million shares. The number of shares used to calculate earnings per share in Q4 2018 is 2,446.6 million shares, reflecting the issuance of shares in the private placement equity offering in December 2017.
Commenting on the results, Yang Xingqiang, Chairman of ADAMA's Board of Directors, said, "Our robust performance, reaching all-time record highs of nearly $3.9 billion in sales and $653 million in EBITDA, continues to demonstrate our ability to overcome challenging market conditions and grow our market share worldwide. ADAMA's vast portfolio of differentiated products and global commercial presence enables us to continue our significant growth momentum."
Chen Lichtenstein, President and CEO of ADAMA, added, "We delivered the strongest fourth quarter results to date, driving double-digit sales growth over the full year, despite continued subdued agricultural commodity prices and challenging weather conditions in key regions. We continue to strengthen our core business by investing in our pipeline of new and differentiated products, executing on our growth strategy."
Performance in Context of Market Environment
The global crop protection market grew somewhat in 2018 due to stronger demand conditions and normalized inventory levels, alongside higher procurement costs emanating from China. This growth was partially offset by challenging weather conditions, especially in Europe, as well as uncertainty surrounding the US-China trade tensions, which weighed on agricultural commodity prices, continuing to impact farmers' incomes for the fourth consecutive year.
In some regions, inventory levels in the crop protection distribution channels were lower compared to 2017, which allowed customary market activity levels to resume.
Softness of many currencies in the fourth quarter, when compared to the same quarter last year, most notably in Brazil and India, impacted sales and profit contribution, yet was more than offset by volume growth and price increases.
As previously communicated, the negative impact of 2017 European hedge positions largely ended in the first half of the year, and had negligible impact on the second half of 2018. There was still, however, a marked effect over the full year period, with a negative impact of almost $40 million on sales and profits.
The Company continues to maintain manufacturing cost discipline and mitigate the impact of shortages in certain raw materials and intermediates, mostly owing to increased environmental focus in China. The supply-constrained environment further contributed to overall stronger pricing.
Despite these uneven AgChem market conditions, the Company delivered record sales in the fourth quarter and full year, significantly exceeding all of its fourth quarter 2017 record sales and adjusted profit metrics, driven by a combination of robust business growth as well as higher prices and the introduction of new and differentiated products, which have supported penetration and continued clear share gains in markets across the globe.
The Company continues to advance collaboration opportunities with other ChemChina group entities, as well as other entities in China, to make the most of its positioning.
Financial Highlights
Revenues grew by 17.3% in the quarter to a record $963 million and by 10.2% in the full year to a record $3,881 million in US dollar terms, compared to the corresponding periods last year. In constant currency terms, revenues grew by 22.8% in the quarter and by 12.4% in the full year.
This robust performance was driven by strong business growth of the Company's increasingly differentiated product portfolio, with volumes up by 15.8% in the quarter and 8.1% in the full year. In the quarter, the Company recorded particularly strong performance in Latin America, led by Brazil, as well as in North America, Europe and Asia-Pacific, while sales in India were impacted by severe drought. In China, ADAMA continues to prioritize the sale of branded, formulated products through its domestic commercial network as well as their export and distribution through the Company's global commercial network, and is shifting away from selling unformulated technical product to other intermediaries.
In addition to the strong business growth, improved demand conditions facilitated a stronger pricing environment, compensating for the softer currencies and allowing the passing on of some of the impact of the constrained supply and higher procurement costs.
Gross profit in the quarter increased by 17.6% to $312 million (gross margin of 32.4%), and by 4.4% to $1,291 million (gross margin of 33.3%) in the full year, compared to the corresponding periods last year.
The higher gross profit in both the quarter and the full year was achieved due to the strong growth and an improved product mix as well as higher pricing, which more than offset the impact of higher procurement costs of raw materials and intermediates, supply shortages and the softer currencies, most notably the Brazilian Real and the Indian Rupee, as well as the impact of missed high-margin sales in Europe in the third quarter as a result of the extreme drought in the region.
Operating expenses. The Company continues to maintain strong operating cost discipline while accommodating significantly higher sales, with total operating expenses of $231 million (24.0% of sales) in the quarter and $850 million (21.9% of sales) in the full year, compared to $220 million (26.8% of sales) and $800 million (22.7% of sales) in the corresponding periods last year, respectively.
Sales and Marketing expenses in the quarter were $163 million (16.9% of sales), in line with $163 million (19.9% of sales) in the corresponding period last year. Sales and Marketing expenses in the full year were $626 million (16.1% of sales), compared to $595 million (16.9% of sales) in the corresponding period last year. The moderate increase over the full year reflects primarily an increase in sales, marketing and product development teams in growing geographies and higher other variable expenses as a result of the increased sales.
General and Administrative expenses in the quarter were $36 million (3.7% of sales) compared to $32 million (3.9% of sales) in the corresponding period last year. General and Administrative expenses in the full year were $135 million (3.5% of sales) compared to $133 million (3.8% of sales) last year.
R&D expenses in the quarter were $16 million (1.6% of sales) compared to $14 million (1.8% of sales) in the corresponding period last year. R&D expenses in the full year were $66 million (1.7% of sales) compared to $53 million (1.5% of sales) in the corresponding period last year, reflecting higher spend on strategic research and development projects.
In addition to these factors, operating expenses in the fourth quarter and the full year benefited somewhat from the softer currencies against the US dollar.
Operating income in the quarter was $81 million, increasing by a significant 79.6% over the corresponding period last year, bringing operating income over the full year to an all-time high of $441 million, above last year's record.
EBITDA in the quarter was $134 million, a strong 34.5% increase over the corresponding period last year, bringing EBITDA over the full year to an all-time high of $653 million, exceeding last year's record.
Financial expenses and investment income. Total net financial expenses and investment income in the quarter were $34 million compared to $33 million in the corresponding period last year. This moderate increase reflects the adoption of a new accounting standard which classifies interest income on sales as revenue. Adjusting for the impact of the change in accounting standard, financial expenses decreased, driven by lower interest costs due to reduced debt levels and a decrease in costs of the shekel-denominated bonds as a result of the depreciation of the currency over the quarter, compared to the corresponding quarter last year. These savings were partially offset by an increase in hedging expenses related to balance sheet positions.
Total net financial expenses and investment income in the full year were $131 million compared to $128 million last year. The moderate increase over the year reflects the adoption of the new accounting standard. Adjusting for the impact of the change in accounting standard, financial expenses decreased over the year, reflecting reduced interest costs due to lower debt levels, as well as foreign exchange income related to balance sheet positions, somewhat offset by an increase in costs of the CPI-linked bonds as a result of an increase in the Israeli CPI over the period.
Income before Tax in the quarter was $47 million, almost four times the corresponding period last year, bringing pre-tax income over the full year to an all-time high of $310 million, above last year's record.
Tax expenses. Net tax expenses were $2 million in the quarter. This compares to a $13 million tax income recorded in the corresponding period last year, which benefited from the creation of deferred tax assets in 2017 in respect of losses carried-forward and timing differences, in anticipation of their expected utilization in subsequent periods, as well as lower taxable income generated in that period.
Net tax expenses in the full year were $61 million compared to $28 million last year. The increase reflects higher taxable income worldwide, most notably in Brazil, as well as the impact of the devaluation of net, non-cash tax assets as a result of the weakening of the Brazilian Real against the US dollar. The relatively low tax expenses recorded last year reflect the mentioned creation of deferred tax assets in respect of losses carried-forward in the fourth quarter of 2017.
Net income in the quarter was a record $46 million, up by 79% compared to the $26 million achieved in the corresponding period last year. Over the full year, net income was $249 million, lower than the record $280 million achieved last year, reflecting the unusually low tax expense incurred in 2017.
Working capital at December 31, 2018 was higher by $258 million compared to the corresponding point last year, supporting the significant momentum generating a $358 million increase in sales over the year.
Strong supply chain discipline allowed maintaining best-ever inventory days for this time of year, while building a higher inventory level in preparation for the upcoming season, as well as absorbing the higher procurement costs.
The significant increase in sales over the quarter and the full year saw trade receivables higher in comparison to the same point last year, despite ongoing tight control of credit ensuring receivable days remain close to their record-best levels for this time of year. The higher receivables were partially offset by increased trade payables.
Cash Flow. Despite the strong sales growth and associated need for higher working capital, the Company generated robust operating cash flow of $79 million in the fourth quarter. This compares to $217 million in the same period last year, during which the Company grew at a somewhat more moderate rate. Over the full year, a significant operating cash flow of $301 million was generated, compared to $586 million generated in the corresponding period last year.
Net cash used in investing activities was $57 million in the quarter and $142 million in the full year, compared to $67 million and $192 million invested in the corresponding periods last year, respectively.
Additions to assets include investments in product registrations and other intangible and fixed assets, including the transfer of products in Europe from Syngenta in the first quarter of 2018. Proceeds from disposal of assets include the divestment of certain products in Europe in the first quarter of 2018 in connection with the approval of the European Commission for ChemChina's acquisition of Syngenta, while in 2017 similarly includes one-time proceeds resulting from the divestment of certain products in the US in the second quarter of 2017 in connection with the approval of the US FTC for ChemChina's acquisition of Syngenta, as well as the sale of non-core assets. Investments in fixed assets, net of investment grants, amounted to $32 million in the quarter and $109 million in the full year, compared to $38 million and $115 million invested in the corresponding periods last year, respectively.
While free cash flow of $14 million was consumed in the quarter compared to the $115 million generated in the corresponding period last year, the Company generated continued free cash flow of $79 million in the full year compared to $310 million last year, despite the Company's strong growth and higher cost environment.
Leverage: Balance sheet net debt at the end of the quarter was $457 million compared to net debt of $442 million as of December 31, 2017, keeping the Company's net debt/EBITDA ratio contained at 0.7x, in line with that of a year ago.
Business Update
Marketing and Product Strategy
To support the Company's implementation of its go-to-market strategy in key markets, and to facilitate more direct contact with farmers, ADAMA together with a leading US academic institution developed a tailor-made development program, providing the Company's marketing and sales teams with systematic methods and customized approaches for each market.
ADAMA developed a new design for its 5-liter packaging, based on input from farmers, aimed at addressing customer pain points. The new and improved series of product packaging will be released in markets across the globe in 2019.
Operations
The Company continues to improve its supply reliability and long-term cost competitiveness by strengthening its manufacturing platform and expanding its supply network to include strategic contract manufacturing partners. This approach is supported by the recruitment of key talent.
Innovation, Development, Research and Registrations
The opening in January 2019 of ADAMA's advanced global R&D Center in Neot Hovav, complements the Company's recently inaugurated, state-of-the-art R&D Center in Nanjing. Together, these two R&D hubs will focus on the development of innovative products through the application of advanced technologies, while also improving existing manufacturing processes with the aim of securing ongoing competitive advantage.
During 2018, the Company obtained 245 new product registrations, including 27 new product launches worldwide. Highlights include CRONNOS TOV®, a novel solution for soybean rust in Brazil and POSTSCRIPT™, a herbicide for control of rice weeds and grasses in FULLPAGE™ Rice varieties in the US. The Company registered its proprietary nematicide NIMITZ® in India, China and South Africa, as well as in Brazil and a number of additional countries in Latin America, and on a range of new crops in the US and Asia Pacific. Other notable product registrations included AGIL®, a systemic herbicide for selective weed control of a wide range of grasses in many broadleaf crops in China and in several European markets, and BREVIS® a differentiated post-bloom fruit thinner in apples to optimize fruit load and size in Australia.
AgTech
In 2018, the Company entered into several AgTech partnerships and launched more than 30 related projects in key markets:
- Chile: TrapView®, which utilizes revolutionary technology in a fully integrated system to provide a simplified solution for growers, agronomists and researchers needing to monitor insect populations
- Thailand: ADAMA partnered with SupPlant™, to introduce innovative systems to support and enhance farmers' decision-making and productivity
- Argentina: Tierra Digital®, a mobile app developed by ADAMA, contains extensive information on crops, including threats to their health and protective solutions for farmers
- Brazil: ADAMA established a partnership to develop ADAMA Air®, aimed at significantly reducing drift and improving quality of aerial application
- ADAMA also developed in Brazil an intelligent system for optimizing operation in sugarcane mills, simplifying decision-making processes and increasing business productivity and profitability through the ADAMA Sagres™ platform
Corporate Development
The Company continues with its track record of making and integrating selective acquisitions.
Bonide: In January 2019, ADAMA acquired Bonide Products Inc., a US provider of pest-control solutions for the consumer Home & Garden market, allowing the Company to bring its advanced technologies and differentiated portfolio of pest-control and turf solutions directly to the benefit of the consumer.
Anpon: On 19 March 2019, the Company signed an agreement for the acquisition of Jiangsu Anpon Electrochemical Co., Ltd. (Anpon). With 2018 sales of approximately $230 million and located in Huai'An, Jiangsu Province, Anpon is a backward-integrated manufacturer of key active ingredients used in crop protection markets worldwide, most notably Ethephon, Pymetrozine and Buprofezin, as well as intermediates such as chlor-alkali, with advanced membrane production technology.
In recent years, ADAMA benefited from Anpon's strong manufacturing position, enhancing its portfolio with products and differentiated mixtures based on Anpon's molecules. The Company has been able to build leading positions in major markets such as the US, India and Australia. In China, Anpon brings a portfolio of product registrations to the ADAMA offering, as well as a domestic sales force.
Anpon is becoming a key part of ADAMA's global business, adding significant synthesis and formulation capabilities to the Company's China operations. Anpon's advanced synthesis site is located adjacent to ADAMA's new global formulation facility, facilitating improved utilization and exchange of expertise. ADAMA's state-of-the art R&D center in Nanjing already contributes to key process improvements at Anpon.
The purchase price of the transaction, which is now being closed, is approximately $62 million (RMB 415 million), with a potential additional payment of up to approximately $60 million, depending on the realization of benefits from the future relocation of some of Anpon's manufacturing facilities.
Huifeng: On January 10, 2019, the Company signed a memorandum of understanding with Jiangsu Huifeng Bio Agriculture Co., Ltd (Huifeng), a chemical manufacturer located in Dafeng, Jiangsu province, for the potential acquisition of most of its crop protection business. With this potential acquisition, ADAMA will gain access to backward-integrated and competitive positions in key molecules, which it intends to use to drive significant growth through its China and worldwide market reach.
Collaboration
ADAMA has been working together with Syngenta and other key agriculture-related businesses in China, to identify opportunities for closer collaboration. In this context, the companies are exploring various initiatives, including the potential provision of reciprocal access to certain products in specific territories, as well as exploiting opportunities aimed at optimizing the utilization of the companies' operational facilities.
Company Name Change
In December 2018, the name of the Company was changed to ADAMA Ltd., achieving the final milestone in the combination between Adama Agricultural Solutions Ltd. and Hubei Sanonda Ltd. While the stock abbreviations of the Company's A-shares and B-shares have changed to ADAMA (A) and ADAMA (B), the stock codes (tickers) remain the same – 000553 and 200553, respectively.
Jingzhou Old Site
At the end of January 2019, preceding the Spring Festival, the Company voluntarily suspended operations at Sanonda's old site in Jingzhou, which is in the process of being relocated to a nearby advanced site, due to recording of higher than permitted levels of wastewater compounds. The Company was subsequently instructed by the local government not to resume operations before rectification. The Company is working to rectify the discharge levels and resume operations at the old site as soon as possible.
In recent years, the Company has already invested $125 million in the relocation of the Jingzhou old site, and has installed advanced production and environmental facilities at a new and already operational site, including an investment of $16 million in a state-of-the-art wastewater treatment facility, which is ready to commence operation.
According to the rectification plan underway, the Company began commissioning of the new wastewater treatment facility at the new site, which will also serve the old site, and expects to commence gradual resumption of operations at the old site around the end of March.
Notwithstanding that the old site produces only a small number of products for the group, and the fact that ADAMA has significant production and procurement capabilities elsewhere in China and worldwide, the suspension is expected to have a negative impact on the Company's performance, mostly in the first and second quarters of 2019. In the first quarter, the Company foresees an impact of low double-digit millions of dollars on its performance.
Regional Sales Performance
Q4 2018 $m | Q4 2017 $m | Change USD | Change CER | FY 2018 $m | FY 2017 $m | Change USD | Change CER | |||
Europe | 188 | 154 | +22.4% | +24.1% | 1,058 | 1046 | +1.1% | -0.7% | ||
North America | 204 | 159 | +28.3% | +28.4% | 735 | 646 | +13.8% | +13.4% | ||
Latin America | 347 | 254 | +36.5% | +48.9% | 935 | 751 | +24.5% | +36.6% | ||
Asia Pacific | 124 | 141 | -12.2% | -9.6% | 610 | 584 | +4.5% | +2.8% | ||
Of which China | 43 | 68 | -36.3% | -33.6% | 275 | 255 | +7.5% | +4.5% | ||
India, Middle East & Africa | 100 | 113 | -11.4% | -4.9% | 543 | 496 | +9.3% | +13.3% | ||
Total | 963 | 821 | +17.3% | +22.8% | 3,881 | 3,523 | +10.2% | +12.4% |
CER: Constant Exchange Rates
Europe: Closed 2018 in line with 2017, a significant achievement in the face of several challenges during the year – severe drought, 2017 hedge loss, supply shortages and a notable change in portfolio due to the completion of the divestments and transfers of products related to ChemChina's acquisition of Syngenta.
Sales increased by 24.1% in the quarter and were flat in the full year in constant currency terms, compared with the corresponding periods last year.
The strong increase in the quarter was driven by significant business growth of 23.8% and modest price increases, which more than offset the negative impact of currency moves.
This strong result in the quarter brought the performance in Europe over the full year to modest growth, despite the challenging weather conditions that persisted for significant parts of the year. This performance over the year, against the backdrop of a decline in the overall European market, saw ADAMA continue to grow its market share in the region.
Following the unprecedented drought earlier in the year, Northern Europe grew strongly in the fourth quarter. The late sowing and favorable rainfall, which started in early October, facilitated continuous planting, extending the herbicide treatment period and allowing for the recovery of herbicide sales mainly in wheat, cereals and oilseed rape.
ADAMA saw particularly strong performance in the Ukraine, where it launched a number of new products including KARNEOL®, a distinctive fungicide for orchards combining a high-strength fungicide with complementary phosphoric-potash plant nutrition, CALMA®, a differentiated, fast-acting plant growth regulator for use in cereals, and TRIMBITA®, a three-way mixture seed treatment for the combined management of both insects and disease in cereals. The Company also grew strongly in Germany and the Czech Republic, as well as in Russia where its comprehensive sugar beet portfolio performed well.
In Southern Europe, sales grew in the quarter compared with the corresponding period last year despite ongoing challenging weather conditions, with the summer drought only breaking in early November. This resulted in delayed herbicide consumption and reduction of grass treatment due to lower oilseed rape planted areas, as well as lower demand for insecticides due to the late emergence of wheat.
ADAMA performed well in the southwestern markets, especially in Spain and Italy, as well as in France where it saw demand leading into the upcoming season.
The Company received several product registrations in the fourth quarter in France, Spain, Portugal, Greece and Italy, all planned for launch in the 2019 season.
In US dollar terms, sales in Europe grew by 22.4% in the fourth quarter and by 1.1% over the full year compared with the corresponding periods last year.
North America: Sales increased by a strong 28.4% in the quarter in constant currency terms, compared with the corresponding period last year, driven by significant business growth and higher prices. The marked performance in the quarter brought growth in the full year to 13.4% in constant currency terms.
The Company's robust business growth in the quarter was driven by strong demand for ADAMA's increasingly differentiated portfolio from both distributors and retail customers. In the US, the Company benefited from the stronger pricing environment, which continued in the face of industry-wide supply shortages, compensating for the higher procurement costs.
Double-digit growth was recorded in Consumer and Professional Solutions, with continued strong momentum in both professional pest and industrial vegetation management.
In US dollar terms, sales in North America increased by 28.3% in the quarter and by 13.8% in the full year, compared to the corresponding periods last year.
Latin America: Sales increased by a significant 48.9% in the quarter and by 36.6% in the full year in constant currency terms, compared with the corresponding periods last year.
The robust growth in the fourth quarter was driven by a strong performance in Brazil, alongside growth in most other markets throughout the region.
ADAMA continues to develop its differentiated portfolio in the region. In Brazil, CRONNOS TOV®, the novel, three-way mixture fungicide for soybean rust, outperformed expectations in its first half-year of launch and led a strong performance across the Company's differentiated portfolio, with noteworthy performances also from a number of key products, including GALIL®, a unique mixture insecticide and the EXPERTGROW® range of biostimulants.
ADAMA recovered strongly in Argentina in the quarter, despite the significant rainfall that delayed the planting season in soybean and corn. The Company successfully launched BOOMER®, a three-way mixture insecticide providing an effective treatment for high insect pressure. The Company also saw strong performances in the quarter in Colombia and Mexico.
Nimitz®, the Company's innovative nematicide was launched in Chile and registered in other countries across the region, while CRONNOS TOV® was also launched in Paraguay and registered in Bolivia. In addition, the Company obtained several new registrations, including vegetables mixture insecticide KADABRA® in Ecuador and Colombia as well as TRIVOR®, a differentiated combination insecticide for rapid and extended control of sucking pests in Citrus in Colombia.
In US dollar terms, sales in Latin America increased by 36.5% in the quarter and by 24.5% in the full year compared with the corresponding periods last year, reflecting the softer local currencies.
Asia-Pacific: Sales were lower by 9.6% in the quarter in constant currency terms, compared with the corresponding period last year, with a strong performance in the wider region being more than offset by shifting away from lower-margin sales to intermediaries globally and in China towards direct sales through the Company's global network. Over the full year, sales increased by 2.8% in constant currency terms.
With strong demand for the Company's differentiated, formulated and branded products, ADAMA continues to prioritize the sale of these products through its own channels by rapidly shifting away from selling unformulated, technical product to intermediaries, and in so doing benefiting from the full product positioning as well as end-to-end margin. This shifting reduces total sales in China; however, sales of the Company's branded, formulated sales in China continue their strong growth, increasing by 40% over the full year.
In the rest of Asia-Pacific, ADAMA grew strongly in the fourth quarter, driven by solid business growth and the introduction of new, differentiated products alongside higher prices. This growth was achieved despite severe drought in Australia and Indonesia, and floods in Vietnam, with strong performance from Thailand, Korea and Japan. ADAMA continues to gain market share across the region.
During the quarter, the Company obtained a number of new registrations for differentiated products, including FLAGSHIP®, a new high-load herbicide for woody weed control, PLATINUM® a new high-load grass herbicide, WASP FORCE® for outdoor wasp control in the Consumer & Professional market, all registered in Australia, as well as NIMITZ®, the Company's proprietary nematicide for use in Black Pepper in Vietnam, and GALIL®, a differentiated insecticide mixture for rice in Philippines.
In US dollar terms, sales were lower by 12.2% in the quarter, while sales increased by 4.5% in the full year, compared to the corresponding periods last year.
India, Middle East & Africa: Sales were lower by 4.9% in the quarter in constant currency terms, compared with the corresponding period last year, with extremely dry weather conditions in India and South Africa negatively impacting sales.
However, despite the subdued performance in the quarter, the Company delivered strong double-digit growth in the full year, with sales increasing by 13.3% in constant currency terms. This significant growth was driven by continued business growth alongside higher prices, supported by robust demand for the Company's differentiated portfolio and generally favorable weather conditions in the first nine months of the year. The Company grew strongly in most markets across the region, most notably in India, Turkey, Israel and West Africa.
In the fourth quarter, the Company registered NIMITZ® in India, to be launched during 2019. This follows multiple product launches in the country in 2018, including BARAZIDE®, an effective combination solution for the control of a wide range of lepidopteran pests, SHAMIR®, a novel dual mode of action fungicide and NIMROD® a systemic fungicide with both protective and curative activity against powdery mildew.
In US dollar terms, sales were lower by 11.4% in the quarter while sales increased by 9.3% in the full year, compared to the corresponding periods last year, reflecting the softer local currencies, most notably the Indian Rupee and Turkish Lira, against the US dollar.
Revenues by operating segment
Fourth quarter sales
Q4 2018 | % | Q4 2017 | % | ||
USD(m) | USD(m) | ||||
Crop Protection | 900 | 93.5% | 748 | 91.1% | |
Intermediates and Ingredients | 63 | 6.5% | 73 | 8.9% | |
Total | 963 | 100% | 821 | 100% |
Full year sales
FY 2018 | % | FY 2017 | % | ||
USD(m) | USD(m) | ||||
Crop Protection | 3,617 | 93.2% | 3,259 | 92.5% | |
Intermediates and Ingredients | 264 | 6.8% | 264 | 7.5% | |
Total | 3,881 | 100% | 3,523 | 100% |
Further Information
All filings of the Company, together with a presentation of the key financial highlights of the period, can be accessed through the Company website at www.adama.com.
About ADAMA
ADAMA Ltd. is one of the world's leading crop protection companies. We strive to Create Simplicity in Agriculture – offering farmers effective products and services that simplify their lives and help them grow. With one of the most comprehensive and diversified portfolios of differentiated, quality products, our 6,600-strong team reaches farmers in over 100 countries, providing them with solutions to control weeds, insects and disease, and improve their yields. For more information, visit us at www.ADAMA.com and follow us on Twitter® at @ADAMAAgri.
Abridged Consolidated Financial Statements
The following abridged consolidated financial statements and notes have been prepared as described in Note 1. While prepared based on the principles of PRC GAAP, they do not contain all of the information which either PRC GAAP or IFRS would require for a complete set of financial statements and should be read in conjunction with the consolidated financial statements of both ADAMA Ltd. and Adama Agricultural Solutions Ltd. as filed with the Shenzhen and Tel Aviv Stock Exchanges, respectively.
Abridged Consolidated Income Statement for the Fourth Quarter
Adjusted[1] | Q4 2018 USD(m) | Q4 2017 USD(m) | Q4 2018 RMB(m) | Q4 2017 RMB(m) |
Revenues | 963 | 821 | 6,660 | 5,425 |
Cost of Sales | 647 | 553 | 4,476 | 3,657 |
Business taxes and surcharges | 4 | 2 | 27 | 13 |
Gross profit | 312 | 265 | 2,157 | 1,755 |
% of revenue | 32.4% | 32.3% | 32.4% | 32.3% |
Operating expenses | 231 | 220 | 1,596 | 1,456 |
Operating income (EBIT) | 81 | 45 | 561 | 299 |
% of revenue | 8.4% | 5.5% | 8.4% | 5.5% |
Financial expenses and investment income | 34 | 33 | 233 | 216 |
Income before taxes | 47 | 12 | 328 | 83 |
Taxes on Income | 2 | -13 | 13 | -86 |
Net income | 46 | 26 | 316 | 169 |
% of revenue | 4.7% | 3.1% | 4.7% | 3.1% |
EBITDA | 134 | 100 | 928 | 656 |
% of revenue | 13.9% | 12.2% | 13.9% | 12.2% |
Earnings per Share – Basic | 0.0186 | 0.0109 | 0.1290 | 0.0720 |
– Diluted | 0.0186 | 0.0109 | 0.1290 | 0.0720 |
The number of shares used to calculate earnings per share in Q4 2017 is 2,341.9 million shares. The number of shares used to calculate earnings per share in Q4 2018 is 2,446.6 million shares, reflecting the issuance of shares in the private placement equity offering in December 2017.
[1] For an analysis of the differences between the adjusted income statement items and the income statement items as reported in the financial statements, see below "Analysis of Gaps between Adjusted Income Statement and Income Statement in Financial Statements".
Abridged Consolidated Income Statement for the Full Year
Adjusted[1] | FY 2018 USD(m) | FY 2017 USD(m) | FY 2018 RMB(m) | FY 2017 RMB(m) |
Revenues | 3,881 | 3,523 | 25,615 | 23,820 |
Cost of Sales | 2,577 | 2,277 | 17,018 | 15,393 |
Business taxes and surcharges | 12 | 9 | 81 | 62 |
Gross profit | 1,291 | 1,237 | 8,516 | 8,364 |
% of revenue | 33.3% | 35.1% | 33.2% | 35.1% |
Operating expenses | 850 | 800 | 5,629 | 5,399 |
Operating income (EBIT) | 441 | 436 | 2,887 | 2,965 |
% of revenue | 11.4% | 12.4% | 11.3% | 12.4% |
Financial expenses and investment | 131 | 128 | 862 | 862 |
Income before taxes | 310 | 308 | 2,025 | 2,103 |
Taxes on Income | 61 | 28 | 396 | 193 |
Net income | 249 | 280 | 1,629 | 1,909 |
% of revenue | 6.4% | 8.0% | 6.4% | 8.0% |
EBITDA | 653 | 646 | 4,288 | 4,374 |
% of revenue | 16.8% | 18.3% | 16.7% | 18.3% |
Earnings per Share – Basic | 0.1017 | 0.1196 | 0.6657 | 0.8153 |
– Diluted | 0.1017 | 0.1196 | 0.6657 | 0.8153 |
[2] For an analysis of the differences between the adjusted income statement items and the income statement items as reported in the financial statements, see below "Analysis of Gaps between Adjusted Income Statement and Income Statement in Financial Statements".
Abridged Consolidated Balance Sheet
December 31 2018 USD (m) | December 31 2017 USD (m) | December 31 018 RMB (m) | December 31 2017 RMB (m) | ||
Assets | |||||
Current assets: | |||||
Cash at bank and on hand | 908 | 1,204 | 6,233 | 7,869 | |
Bills and accounts receivable | 1,068 | 801 | 7,330 | 5,237 | |
Inventories | 1,347 | 1,146 | 9,247 | 7,488 | |
Assets held for sale | - | 62 | - | 403 | |
Other current assets, receivables and | 274 | 357 | 1,879 | 2,333 | |
Total current assets | 3,597 | 3,570 | 24,689 | 23,330 | |
Non-current assets: | |||||
Fixed assets, net | 1,029 | 1,063 | 7,063 | 6,945 | |
Intangible assets, net | 1,423 | 1,213 | 9,763 | 7,927 | |
Deferred tax assets | 107 | 136 | 733 | 891 | |
Other non-current assets | 82 | 80 | 564 | 521 | |
Total non-current assets | 2,641 | 2,492 | 18,123 | 16,284 | |
Total assets | 6,238 | 6,063 | 42,813 | 39,614 | |
Liabilities | |||||
Current liabilities: | |||||
Loans and credit from banks and other lenders | 127 | 418 | 875 | 2,729 | |
Bills and accounts payable | 731 | 646 | 5,019 | 4,218 | |
Other current liabilities | 793 | 665 | 5,446 | 4,348 | |
Total current liabilities | 1,652 | 1,729 | 11,339 | 11,295 | |
Long-term liabilities: | |||||
Long-term loans from banks and other lenders | 34 | 79 | 236 | 514 | |
Debentures | 1,115 | 1,190 | 7,649 | 7,777 | |
Deferred tax liabilities | 57 | 34 | 392 | 225 | |
Employee benefits | 85 | 93 | 580 | 611 | |
Other long-term liabilities | 49 | 63 | 336 | 413 | |
Total long-term liabilities | 1,339 | 1,460 | 9,193 | 9,540 | |
Total liabilities | 2,992 | 3,189 | 20,533 | 20,836 | |
Equity | |||||
Total equity | 3,246 | 2,874 | 22,280 | 18,778 | |
Total equity | 3,246 | 2,874 | 22,280 | 18,778 | |
Total liabilities and equity | 6,238 | 6,063 | 42,813 | 39,614 |
Abridged Consolidated Cash Flow Statement for the Fourth Quarter
Q4 2018 USD (m) | Q4 2017 USD (m) | Q4 2018 RMB (m) | Q4 2017 RMB (m) | ||
Cash flow from operating activities: | |||||
Cash flow from operating activities | 79 | 217 | 548 | 1,437 | |
Cash flow from operating activities | 79 | 217 | 548 | 1,437 | |
Investing activities: | |||||
Acquisitions of fixed and intangible assets | -59 | -67 | -410 | -442 | |
Proceeds from disposal of fixed and intangible assets | 1 | - | 8 | 2 | |
Other investing activities | 1 | - | 10 | - | |
Cash flow used for investing activities | -57 | -67 | -392 | -440 | |
Financing activities: | |||||
Receipt of loans from banks and other lenders | 16 | 307 | 111 | 2,031 | |
Repayment of loans from banks and other lenders | -29 | -86 | -198 | -571 | |
Other financing activities | -37 | 175 | -247 | 1,159 | |
Cash flow from (used for) financing activities | -49 | 396 | -334 | 2,619 | |
Effects of exchange rate movement on cash and cash | 1 | 3 | -13 | -88 | |
Net change in cash and cash equivalents | -26 | 550 | -191 | 3.528 | |
Cash and cash equivalents at the beginning of the period | 926 | 653 | 6,371 | 4,337 | |
Cash and cash equivalents at the end of the period | 900 | 1,204 | 6,180 | 7,864 | |
Free Cash Flow | -14 | 115 | -99 | 763 |
Abridged Consolidated Cash Flow Statement for the Full Year
FY 2018 USD (m) | FY 2017 USD (m) | FY 2018 RMB (m) | FY 2017 RMB (m) | ||
Cash flow from operating activities: | |||||
Cash flow from operating activities | 301 | 586 | 2,002 | 3,958 | |
Cash flow from operating activities | 301 | 586 | 2,002 | 3,958 | |
Investing activities: | |||||
Acquisitions of fixed and intangible assets | -523 | -223 | -3,376 | -1,503 | |
Proceeds from disposal of fixed and intangible assets | 381 | 14 | 2,421 | 97 | |
Other investing activities | - | 17 | - | 118 | |
Cash flow used for investing activities | -142 | -192 | -954 | -1,288 | |
Financing activities: | |||||
Receipt of loans from banks and other lenders | 29 | 334 | 196 | 2,212 | |
Repayment of loans from banks and other lenders | -361 | -185 | -2,314 | -1,247 | |
Other financing activities | -118 | 104 | -773 | 671 | |
Cash flow from (used for) financing activities | -450 | 253 | -2,892 | 1,636 | |
Effects of exchange rate movement on cash and cash | -12 | 3 | 159 | -276 | |
Net change in cash and cash equivalents | -303 | 651 | -1,684 | 4,031 | |
Cash and cash equivalents at the beginning of the period | 1,204 | 553 | 7,864 | 3,834 | |
Cash and cash equivalents at the end of the period | 900 | 1,204 | 6,180 | 7,864 | |
Free Cash Flow | 79 | 310 | 528 | 2,097 |
Notes to Abridged Consolidated Financial Statements
Note 1: Basis of preparation
Basis of presentation and accounting policies: The abridged consolidated financial statements for the years ended December 31, 2018 and 2017 incorporate the financial statements of ADAMA Ltd. and of all of its subsidiaries (the "Company"), including Adama Agricultural Solutions Ltd. ("Solutions") and its subsidiaries.
The Company has adopted the Accounting Standards for Business Enterprises issued by the Ministry of Finance (the "MoF") and the implementation guidance, interpretations and other relevant provisions issued or revised subsequently by the MoF (collectively referred to as "CASBE").
The abridged consolidated financial statements contained in this release are presented in both Chinese Renminbi (RMB), as the Company's shares are traded on the Shenzhen Stock Exchange, as well as in United States dollars ($) as this is the major currency in which the Company's business is conducted. For the purposes of this release, a customary convenience translation has been used for the translation from RMB to US dollars, with Income Statement and Cash Flow items being translated using the quarterly average exchange rate, and Balance Sheet items being translated using the exchange rate at the end of the period.
The preparation of financial statements requires management to make estimates and assumptions that affect the reported amounts of assets and liabilities and disclosure of contingent assets and liabilities at the date of the financial statements, and the reported amounts of revenues and expenses during the reporting period. Actual results could differ from those estimated.
Note 2: Abridged Financial Statements
For ease of use, the Financial Statements shown in this release have been abridged as follows:
Abridged Consolidated Income Statement:
- "Operating expenses" includes selling and distribution expenses; general and administrative expenses; research and development expenses; impairment losses; gain (loss) from disposal of assets and non-operating income and expenses
- "Financial expenses and investment income" includes net financing expenses; gains from changes in fair value; and investment income (including share of income of equity accounted investees)
Abridged Consolidated Balance Sheet:
- "Other current assets, receivables and prepaid expenses" includes financial assets held for trading; financial assets in respect of derivatives; prepayments; other receivables; and other current assets
- "Fixed assets, net" includes fixed assets and construction in progress
- "Intangible assets, net" includes intangible assets and goodwill
- "Other non-current assets" includes other equity investments; long-term equity investments; long-term receivables; investment property; and other non-current assets
- "Loans and credit from banks and other lenders" includes short-term loans and non-current liabilities due within one year
- "Other current liabilities" includes financial liabilities in respect of derivatives; payables for employee benefits, taxes, interest, dividends and others; advances from customers and other current liabilities
- "Other long-term liabilities" includes long-term payables, provisions, deferred income and other non-current liabilities
Analysis of Gaps between Adjusted Income Statement and Reported Income Statement in Financial Statements
Q4 | Adjusted | Adjustments | Reported | |||
USD(m) | Q4 2018 | Q4 2017 | Q4 2018 | Q4 2017 | Q4 2018 | Q4 2017 |
Revenues | 963 | 821 | - | - | 963 | 821 |
Gross profit | 312 | 265 | 3 | -9 | 309 | 275 |
Operating expenses | 231 | 220 | -52 | -51 | 283 | 271 |
Operating income (EBIT) | 81 | 45 | 55 | 41 | 26 | 4 |
Income before taxes | 47 | 12 | 61 | 41 | -14 | -29 |
Net income | 46 | 26 | 66 | 34 | -20 | -8 |
EBITDA | 134 | 100 | 4 | 27 | 130 | 72 |
Earnings per share | 0.0186 | 0.0109 | 0.0269 | 0.0144 | -0.0083 | -0.0035 |
Q4 | Adjusted | Adjustments | Reported | |||
RMB(m) | Q4 2018 | Q4 2017 | Q4 2018 | Q4 2017 | Q4 2018 | Q4 2017 |
Revenues | 6,660 | 5,425 | - | - | 6,660 | 5,425 |
Gross profit | 2,157 | 1,755 | 18 | -61 | 2,139 | 1,815 |
Operating expenses | 1,596 | 1,456 | -363 | -334 | 1,959 | 1,790 |
Operating income (EBIT) | 561 | 299 | 381 | 273 | 180 | 25 |
Income before taxes | 328 | 83 | 422 | 273 | -94 | -191 |
Net income | 316 | 169 | 455 | 222 | -140 | -54 |
EBITDA | 928 | 656 | 27 | 181 | 901 | 475 |
Earnings per share | 0.1290 | 0.0720 | 0.1862 | 0.0949 | -0.0572 | -0.0229 |
FY | Adjusted | Adjustments | Reported | |||
USD(m) | FY 2018 | FY 2017 | FY 2018 | FY 2017 | FY 2018 | FY 2017 |
Revenues | 3,881 | 3,523 | - | - | 3,881 | 3,523 |
Gross profit | 1,291 | 1,237 | 11 | 2 | 1,280 | 1,235 |
Operating expenses | 850 | 800 | 215 | -63 | 636 | 864 |
Operating income (EBIT) | 441 | 436 | -203 | 65 | 644 | 371 |
Income before taxes | 310 | 308 | -197 | 65 | 507 | 243 |
Net income | 249 | 280 | -129 | 54 | 378 | 226 |
EBITDA | 653 | 646 | -307 | 20 | 959 | 625 |
Earnings per share | 0.1017 | 0.1196 | -0.0527 | 0.0232 | 0.1543 | 0.0964 |
FY | Adjusted | Adjustments | Reported | |||
RMB(m) | FY 2018 | FY 2017 | FY 2018 | FY 2017 | FY 2018 | FY 2017 |
Revenues | 25,615 | 23,820 | - | - | 25,615 | 23,820 |
Gross profit | 8,516 | 8,364 | 77 | 10 | 8,440 | 8,354 |
Operating expenses | 5,629 | 5,399 | 1,329 | -424 | 4,300 | 5,824 |
Operating income (EBIT) | 2,887 | 2,965 | -1,252 | 435 | 4,139 | 2,530 |
Income before taxes | 2,025 | 2,103 | -1,211 | 435 | 3,236 | 1,668 |
Net income | 1,629 | 1,909 | -774 | 363 | 2,402 | 1,546 |
EBITDA | 4,288 | 4,374 | -1,949 | 131 | 6,237 | 4,243 |
Earnings per share | 0.6657 | 0.8153 | -0.3163 | 0.1552 | 0.9820 | 0.6601 |
Income Statement Adjustments
Q4 2018 USD (m) | Q4 2017 USD (m) | Q4 2018 RMB (m) | Q4 2017 RMB (m) | ||||||
Net Income (Reported) | -20.3 | -8.1 | -140.0 | -53.6 | |||||
Non-cash legacy amortization of 2011 PPA for acquisition of Solutions, net of tax | 9.5 | 9.5 | 65.7 | 62.8 | |||||
Non-cash amortization of Transfer assets received from Syngenta related to 2017 | 10.6 | - | 73.0 | - | |||||
Combination Transaction – one-time professional fee; employee bonuses | - | 3.7 | - | 24.7 | |||||
One-time capital gain from sale of EU and US registrations, related to 2017 ChemChina- | 3.1 | - | 21.7 | - | |||||
Jingzhou old facility fixed asset impairment, net of tax effect | 28.3 | 9.1 | 195.6 | 58.6 | |||||
Historical tax expenses resulting from the finalization of tax assessments | 8.4 | 25.4 | 58.2 | 167.9 | |||||
Reinstatement of depreciation expense due to classification of to-be-divested European | - | -3.5 | - | -22.8 | |||||
Creation of deferred tax asset on losses carried forward in anticipation of their expected | - | -28.7 | - | -190.0 | |||||
One-time non-cash provision for post-employment & early retirement of Sanonda employees | - | 11.7 | - | 79.4 | |||||
Adjustment of 2017 LTI provision made in Q4 to accrual over full year | - | 6.3 | - | 41.9 | |||||
Revaluation of non-cash adjustment related to non-controlling interest | 6.0 | - | 41.3 | - | |||||
Total adjustments | 65.9 | 33.6 | 455.5 | 222.5 | |||||
Net Income (Adjusted) | 45.5 | 25.5 | 315.5 | 168.7 | |||||
FY 2018 USD (m) | FY 2017 USD (m) | FY 2018 RMB (m) | FY 2017 RMB (m) | |||||
Net Income (Reported) | 377.6 | 225.8 | 2,402.5 | 1,545.9 | ||||
Non-cash legacy amortization of 2011 PPA for acquisition of Solutions, net of tax | 38.0 | 38.0 | 251.4 | 256.8 | ||||
Non-cash amortization of Transfer assets received from Syngenta related to 2017 | 30.9 | - | 207.0 | - | ||||
Jingzhou old facility fixed asset impairment, net of tax effect | 28.3 | 9.1 | 195.6 | 58.6 | ||||
Combination Transaction – one-time professional fee; taxes; employee bonuses | 1.5 | 9.5 | 9.4 | 63.2 | ||||
One-time capital gain from sale of EU & US registrations, related to 2017 ChemChina- | -241.7 | -8.6 | -1,535.0 | -59.0 | ||||
Reinstatement of depreciation expense due to classification of to-be-divested | -2.6 | -4.9 | -16.5 | -32.8 | ||||
Creation of deferred tax asset on losses carried forward in anticipation of their expected | - | -28.7 | - | -190.0 | ||||
Historical tax expenses from finalization of tax assessments, conclusion of tax claims | 8.4 | 28.2 | 58.2 | 187.2 | ||||
One-time non-cash provision for post-employment & early retirement of Sanonda employees | - | 11.7 | - | 79.4 | ||||
Revaluation of non-cash adjustments related to non-controlling interest | 6.0 | - | 41.3 | - | ||||
Non-core asset disposal | 2.3 | - | 14.8 | - | ||||
Total adjustments | -128.9 | 54.3 | -773.8 | 363.3 | ||||
Net Income (Adjusted) | 248.7 | 280.1 | 1,628.7 | 1,909.3 | ||||
Exchange Rate Data for the Company's Principal Functional Currencies
December 31 | Q4 Average | FY Average | |||||||||
2018 | 2017 | Change | 2018 | 2017 | Change | 2018 | 2017 | Change | |||
EUR/USD | 1.145 | 1.198 | (4.4%) | 1.141 | 1.178 | (3.1%) | 1.180 | 1.127 | 4.7% | ||
USD/BRL | 3.875 | 3.308 | (17.1%) | 3.810 | 3.248 | (17.3%) | 3.655 | 3.192 | (14.5%) | ||
USD/PLN | 3.760 | 3.481 | (8.0%) | 3.768 | 3.594 | (4.9%) | 3.612 | 3.779 | 4.4% | ||
USD/ZAR | 14.428 | 12.380 | (16.5%) | 14.284 | 13.580 | (5.2%) | 13.239 | 13.264 | 0.2% | ||
AUD/USD | 0.706 | 0.781 | (9.6%) | 0.717 | 0.769 | (6.7%) | 0.747 | 0.766 | (2.5%) | ||
GBP/USD | 1.279 | 1.350 | (5.3%) | 1.287 | 1.328 | (3.1%) | 1.334 | 1.287 | 3.6% | ||
USD/ILS | 3.748 | 3.467 | (8.1%) | 3.705 | 3.507 | (5.6%) | 3.591 | 3.596 | 0.1% | ||
USD LIBOR 3M | 2.81% | 1.69% | 65.7% | 2.62% | 1.46% | 79.7% | 2.30% | 1.26% | 82.1% | ||
December 31 | Q4 Average | FY Average | |||||||||
2018 | 2017 | Change | 2018 | 2017 | Change | 2018 | 2017 | Change | |||
USD/RMB | 6.863 | 6.534 | 5.0% | 6.916 | 6.611 | 4.6% | 6.612 | 6.755 | (2.1%) | ||
EUR/RMB | 7.859 | 7.826 | 0.4% | 7.892 | 7.785 | 1.4% | 7.806 | 7.612 | 2.5% | ||
RMB/BRL | 0.565 | 0.506 | (11.5%) | 0.551 | 0.491 | (12.2%) | 0.553 | 0.473 | (16.9%) | ||
RMB/PLN | 0.533 | 0.533 | 0.0% | 0.544 | 0.544 | 0.0% | 0.559 | 0.559 | 0.0% | ||
RMB/ZAR | 2.102 | 1.885 | (11.5%) | 2.065 | 1.885 | (9.6%) | 2.002 | 1.878 | (6.6%) | ||
AUD/RMB | 4.844 | 5.103 | (5.1%) | 4.960 | 5.083 | (2.4%) | 4.940 | 5.176 | (4.6%) | ||
GBP/RMB | 8.777 | 8.906 | (1.4%) | 8.897 | 8.726 | 2.0% | 8.821 | 8.670 | 1.8% | ||
RMB/ILS | 0.546 | 0.531 | (2.9%) | 0.536 | 0.531 | (1.0%) | 0.543 | 0.532 | (2.0%) | ||
RMB SHIBOR 3M | 3.35% | 4.91% | (31.9%) | 3.04% | 4.61% | (33.9%) | 3.75% | 4.37% | (14.3%) | ||
Contact | |
Ben Cohen | Zhujun Wang |
Global Investor Relations | China Investor Relations |
Email: ir@adama.com | Email: irchina@adama.com |
![]()


SOURCE Adama Agricultural Solutions Ltd
© 2024 Benzinga.com. Benzinga does not provide investment advice. All rights reserved.
Trade confidently with insights and alerts from analyst ratings, free reports and breaking news that affects the stocks you care about.

